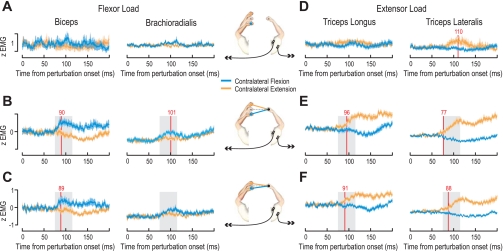
Fig. 2.
Cross-limb reflexes in the unperturbed arm elicited by contralateral perturbations: EMG traces in the unperturbed limb during perturbations of the contralateral limb. Central schematics show EMG recorded from the unperturbed right arm during perturbations of the left arm, with the intermediate hand position representing the preperturbation configuration. The EMG averages shown in the plots also include the mirror-symmetric conditions for EMG recorded from the unperturbed left arm where the right arm was perturbed. A and D: group averages of normalized EMG (see materials and methods) across all subjects in the uncoupled control task (each hand independently controlled a separate bar) when the contralateral arm was perturbed either downward (i.e., flexion, blue trace) or upward (i.e., extension, orange trace). Plots in A are for flexor muscles under the flexor background load condition and plots in D for extensor muscles under the extensor load condition. Shaded areas signify ±SE across subject means. Red vertical line indicates the earliest time at which receiver operating characteristic (ROC) analysis could discriminate between subject average traces for the 2 perturbation conditions (see results). B and E: responses in the coupled single-object task (the 2 hands controlled a single rigid bar) for the large-amplitude perturbations. Plots in B are for flexor muscles under the flexor background load condition and plots in E for extensor muscles under the extensor load background. The gray shaded areas behind the traces indicate the 40-ms period used for statistical analyses (75–115 ms). C and F: as B and E, but for the small-amplitude perturbations.

