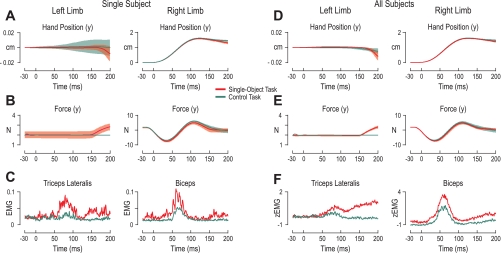
Fig. 3.
Responses during perturbation of the right arm for a single subject and across subjects. A–C are for the left and right limbs of a single subject during perturbations (onset at 0 ms) of the right hand in the arm extension direction for the extensor background load (−2 N). Red and green traces are for the single-object and control tasks, respectively. Lines represent the mean values across all repetitions of this perturbation for this single subject, and shaded areas correspond to ±1 standard deviation from the mean. A: hand position (y-axis). Note the difference in scales of y-axis for the limbs. B: forces exerted between the hand and robotic handle along the y-axis. In the single-object task the unperturbed arm was clamped into position by the robot, whereas in the control task the unperturbed arm was free to move. C: EMG in triceps lateralis of the left arm (left) and the biceps of the right arm (right). D and E: as in A and B, but lines represent averages across subject mean responses and shaded areas represent ±1 standard deviation from the mean across subjects. F: z-normalized EMG (see Data normalization) of the triceps lateralis of the left arm and biceps of the right arm across subjects.

