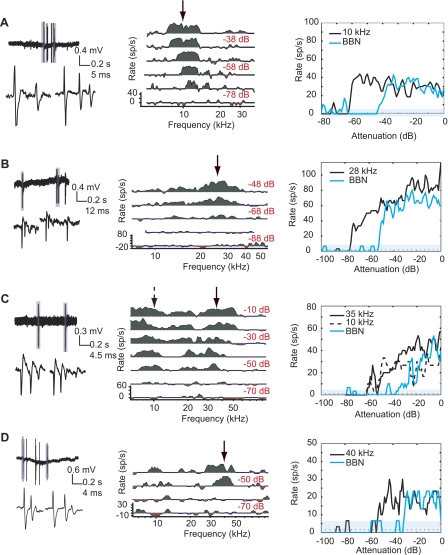
Fig. 2.
Representative data from 4 cartwheel cells. Left: 1-s trace (top) and close-up of complex spike morphology (bottom). Center: that neuron's response map. Frequencies are spaced 1/40th of an octave apart, and all curves are smoothed with a 3-point triangular filter. Response map curves are centered on mean spontaneous rate. Green areas show excitation >1 SD above and red areas show suppression >1 SD below mean spontaneous rate. Response strength is measured during the period 210–410 ms, with the exception of A, where the response was measured from 310–510 ms. Arrow indicates frequencies represented at right. Right: plot of the neuron's response to tones and broadband noise (BBN) at a range of sound levels separated by 1 dB. In rate-level functions, the mean spontaneous rate is plotted as a dashed line surrounded by a cyan region indicating ±1 SD. The goal is to collect the response to BF tones; however, BF of cartwheel cells can be difficult to determine during the experiment. A: BF = 11.2 kHz, threshold = 32 dB SPL. B: BF = 28 kHz, threshold = 10 dB SPL. C: BF = 25 kHz, threshold = 12 dB SPL. D: BF = 40 kHz, threshold = 30 dB SPL.

