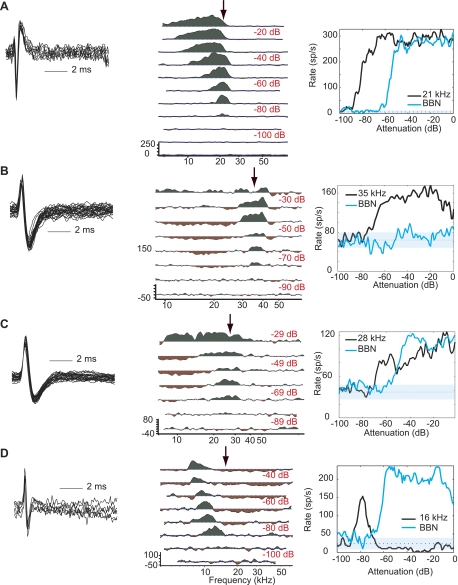
Fig. 3.
Representative type III and IV responses. Left: superimposed spikes from a 1-s period to illustrate spike morphology and isolation. Center: the neuron's response map plotted as in Fig. 2, B–D. Right: plot of the neuron's rate-level function. A: type III response (BF = 21 kHz, threshold = −4 dB SPL). B: type III response (BF = 36 kHz, threshold = 21 dB SPL). C: type III response (BF = 28 kHz, threshold = 16 dB SPL). D: type IV response (BF = 16 kHz, threshold = −12 dB SPL).

