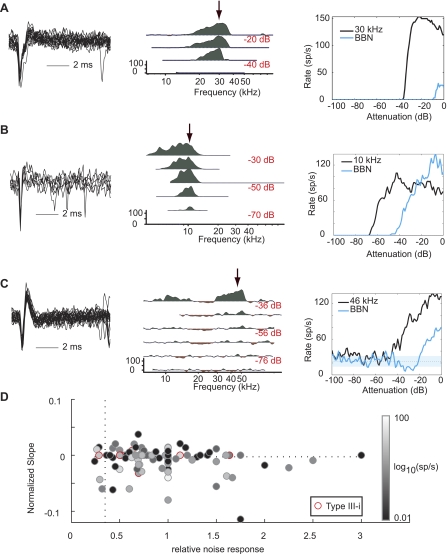
Fig. 4.
Representative putative tuberculoventral neurons. Panels are arranged as in Figs. 2 and 3. A: type II response (BF = 30 kHz, threshold = 50 dB SPL). B: type I/III response (10 kHz, 13 dB SPL). C: type III-i response (BF = 17 kHz, threshold = −10 dB SPL). D: relative noise response is reported for all neurons with complete BF tone and noise rate level functions as (max of noise function/max of tone function). Normalized slope is reported for all neurons as the slope of a line fitted above the first inflection point in the BF tone rate-level function provided that the region being measured was relatively flat for >20 dB (i.e., not a dip in the function). Of the 3 neurons that met the criteria for type II (lower left quadrant), only 1 was not spontaneously active (<2.5 sp/s; A). Type III-i neurons (red outline) were otherwise indistinguishable from the population as a whole.

