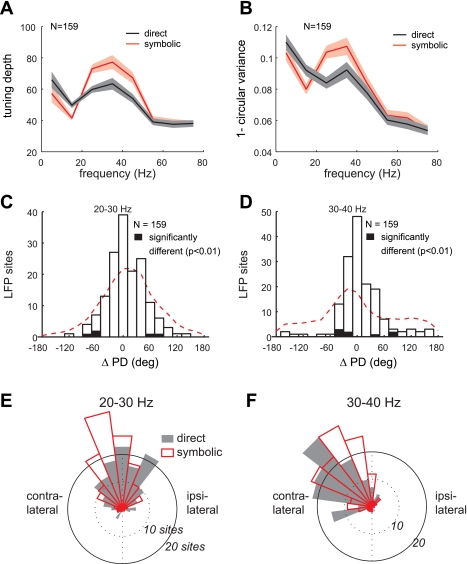
Fig. 6.
Spatial tuning of the LFP activity during the late delay period. A: average tuning depth of the LFP power (mean ± SE) in the 8 different frequency bands in the direct and symbolic tasks. B: average value for (1 − circular variance). C: histogram of difference in preferred directions of the 20–30 Hz band power between direct and symbolic tasks. Filled bars represent the number of LFP sites that show significantly different preferred directions between the 2 tasks. Dashed lines represent the distribution of preferred direction differences for randomly paired LFP sites. D: same as C but for the 30–40 Hz band power. E: distribution of the preferred directions of the 20–30 Hz band power in the 2 tasks. F: same as E but for the 30–40 Hz band.

