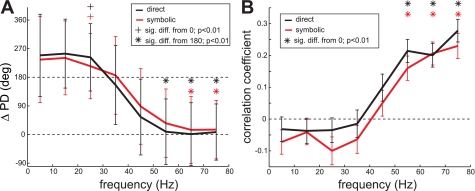
Fig. 7.
Relation of the preferred directions between the spiking and LFP activity. A: average difference (mean ± SD) between the preferred directions of the spike firing rate and the LFP power in each of the 8 frequency bands. Significance of the difference was tested with the circular m-test. B: average correlation coefficient (mean ± SE) between the reach goal tuning curves of the spike firing rate and the LFP power in each frequency band.

