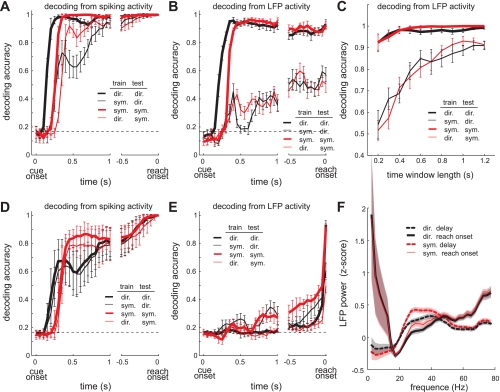
Fig. 8.
Reach goal decoding performance. A: average time course of the decoding performance (mean ± SE) using the spike firing rate of 178 neurons in a 200-ms window sliding with 50-ms steps. For each time point, training data and test data were sampled from the 200-ms window ending at that time point. Thick lines represent the accuracy when training and testing data were from the same task. Thin lines represent the accuracy when training and testing data were from different tasks. Dashed horizontal line indicates chance level performance. B: same as A but using the LFP power of 159 sites. C: decoding performance at reach onset as a function of the time window length used to compute the LFP power for both training and testing data. All time windows ended at reach onset. D: same as A except that the training data for each time point were constant, i.e., the firing rates in the 200 ms ending at reach onset. E: same as D but using the LFP power. F: average LFP power spectra (mean ± SE) across 159 sites for the 200-ms window ending at reach onset vs. the prior 1-s period, from 1,200 ms to 200 ms before reach onset.

