Fig. 4.
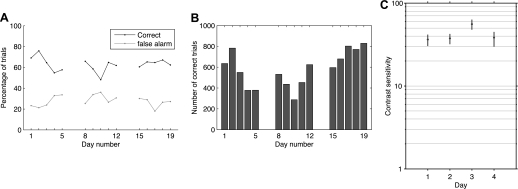
Performance is reliable over days. A and B: data from 1 animal over 3 wk, just before introducing different contrast levels to train to respond near threshold. A: percentage correct and percentage false alarm responses. B: number of correct trials per daily session. C: measured contrast sensitivity for the same animal at the completion of training to respond near threshold, 14 training sessions after data in A and B. Sensitivity (100 divided by threshold contrast in percent) measured as in Fig. 3A. Error bars are 99% confidence intervals computed via bootstrap.

