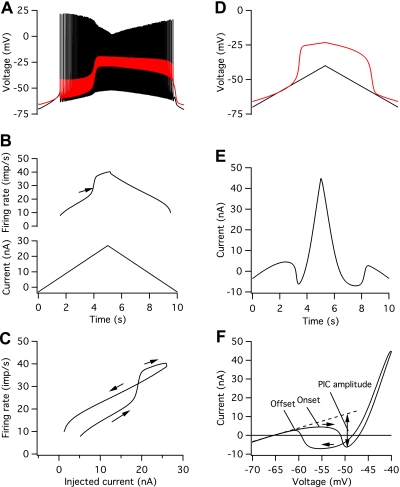
Fig. 1.
Frequency-current (F–I) and I–V relations for a model of a medium-threshold motoneuron. A: somatic (black) and mid-dendritic (red) voltage in response to the triangular injected current command shown in the bottom panel of B. B: time course of instantaneous discharge rate (top) and injected current (bottom). C: F–I relation. Arrows indicate firing rates during the ascending and descending portions of the injected current command. D: somatic (black) and mid-dendritic (red) voltage in response to a somatic voltage-clamp command from −70 to −40 mV and back. E: voltage-clamp current vs. time. F: I–V relation. Horizontal arrows indicate current recorded during the ascending and descending portions of the voltage-clamp command. PIC, persistent inward current.

