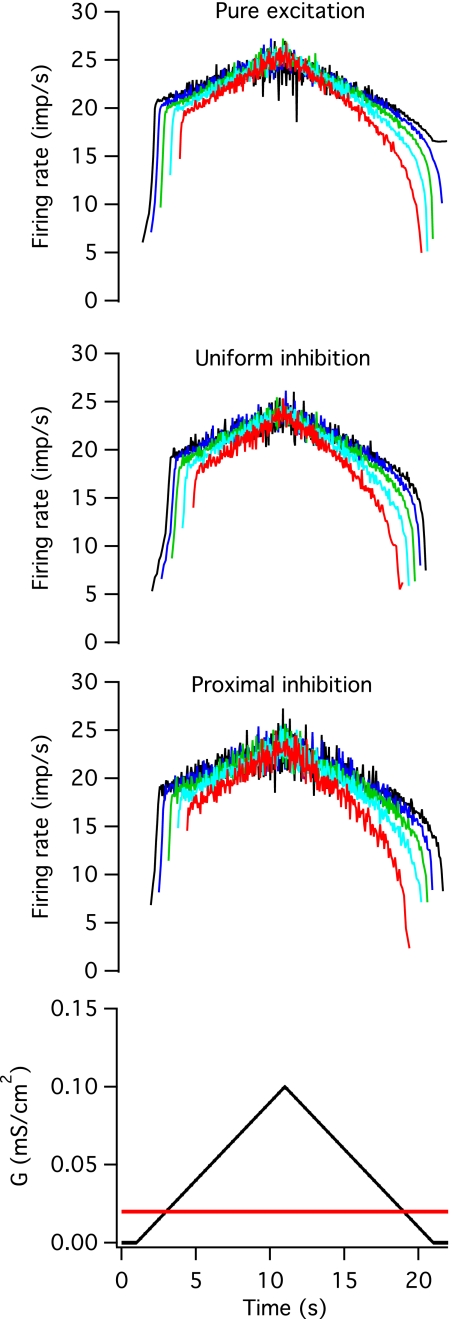
Fig. 5.
Constant inhibition. A constant-background, noisy inhibitory conductance, was added to the noisy, excitatory conductance waveform. The average value of each waveform is shown in the bottom panel (black for excitatory and red for inhibitory). The top panel shows instantaneous firing rates in 5 different models in response to pure excitation for comparison, and the middle panels shows responses when the inhibitory conductance was distributed uniformly across the soma and dendrites (uniform inhibition) or when it was concentrated on the soma and the first 20% of the dendritic cable (proximal inhibition).

