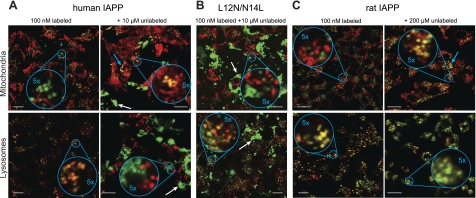
Figure 5.
Intracellular localization of IAPP. Colocalization of hIAPPA488 (A), hIAPPL12N/N14L (B), or rIAPP (C) with MitoTracker (top panels) or LysoTracker (bottom panels) in INS-1 cells. Conditions were 100 nM labeled IAPP with or without indicated concentration of unlabeled protein. Incubations were conducted for 72 h prior to imaging. For hIAPP and rIAPP, the addition of 10 and 200 μM unlabeled material, respectively, reflects conditions when toxicity is observed (Figs. 2 and 3A). White and cyan arrows indicate examples of extracellular aggregates and mitochondrial colocalization, respectively. Scale bars = 10 μm.

