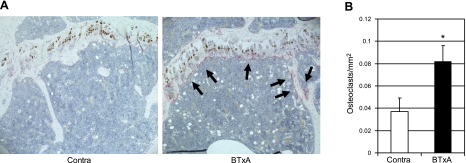
Figure 2.
Increased osteoclastogenesis following muscle paralysis. Representative photomicrographs of TRAP stains (A; red, noted by arrows) and mean ± se number of TRAP positive osteoclasts from the left (contralateral) and right (BTxA) proximal tibial metaphysis (B) of a mouse at 5 d after induction of calf muscle paralysis. *P = 0.04.

