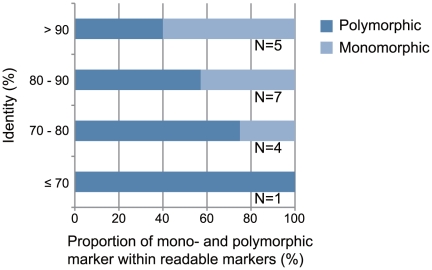
Figure 3. Association between presence of polymorphisms in PCR products and identities between reference genomic regions.
The x-axis indicates the proportion of mono- and polymorphic markers amplified by using the primer pairs designed for Rana ornativentris. Only readable sequences were included in the analysis. The y-axis indicates the identity between reference genomic regions predicted to be amplified by the primers. The number of primer pairs is shown at right of each bar.

