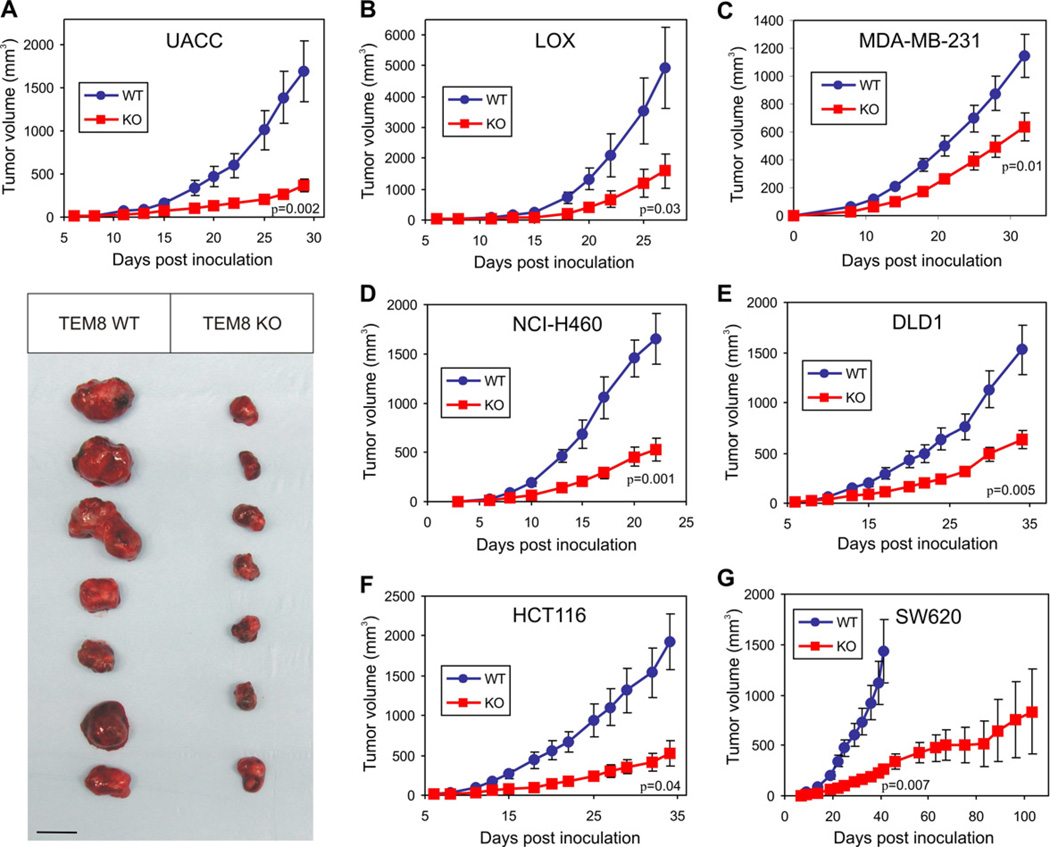
Figure 2. The Growth of Human Tumor Xenografts is Impaired in Tem8 KO Mice.
(A–G) Melanoma (A–B), breast (C), lung (D), and colon (E–G) cancer cell lines were injected into Tem8 wildtype (WT, blue) or knockout (KO, red) mice and tumor volume monitored over time. The physical appearance of the resected UACC tumors is shown in (A). p-values were calculated from the final tumor measurement (A–F) or at day 41 (G) when the WT group reached its maximum size and had to be euthanized (Students t-test). n = 7 to 15 mice/group. Values in (A–G) represent mean ± SE. Bar = 10mm.

