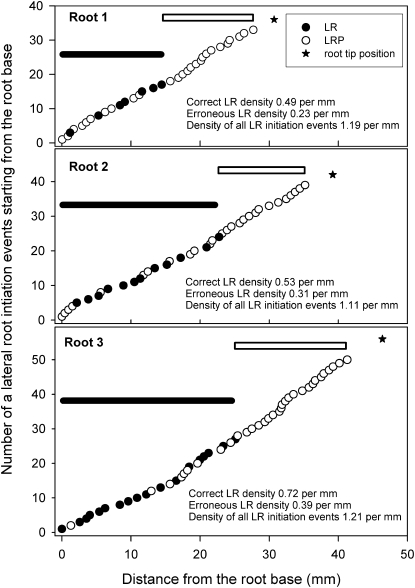
Figure 3.
Distribution of LRs and LRPs in the Primary Root and Density Evaluations.
Roots of three different 8-d-old Col-0 plants are shown. Roots were grown under conditions described by Dubrovsky et al. (2009) and were cleared using the method of Malamy and Benfey (1997). Distances between each subsequent LRP and/or LR were measured with an ocular micrometer under a microscope equipped with Nomarski optics. Note the high variability in these individual distances: Minimum and maximum distances were 266 and 1355 μm (root 1), 278 and 2242 μm (root 2), and 121 and 2145 μm (root 3). The black bar indicates the length of the root portion corresponding to the branching zone (from the shoot base to the most rootward emerged LR), and the white bar indicates the LR formation zone (from the most rootward emerged LR to the most rootward LRP). Note that in each root, primordia are present within the branching root portion. For illustration purposes, “correct” and “erroneous” estimations of LR density are shown. Correct LR density was estimated using the length of the branching zone as the denominator, and erroneous LR density was estimated using the total length of the primary root as the denominator. Density of all LR initiation events was estimated using the sum of the length of the branching zone and LR formation zone as the denominator.

