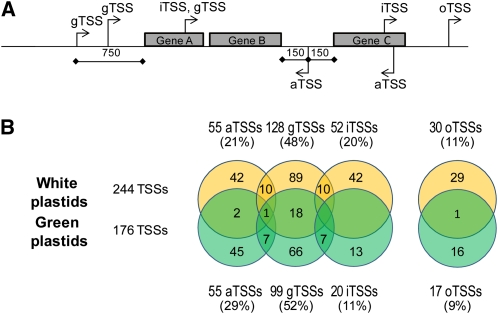
Figure 2.
Classification and Category Assignment of TSSs Based on dRNA-seq.
(A) Schematic representation of the annotation and category assignment of TSSs based on their genomic location in the barley plastome. In certain cases, a TSS can be assigned to more than one category (e.g., iTSS and gTSS). An aTSS that is mapped more than 150 nucleotides downstream of an annotation but is represented by cDNAs that overlap with the 3′ UTR of the gene is still considered as an aTSS.
(B) Distribution and overlap among TSS categories in green and white plastids. A total of 244 and 176 TSSs were mapped in white and green plastids, respectively. TSSs were further grouped into four categories. The number and percentage (in parentheses) of TSSs assigned to each category is given. Twenty-one TSSs in white and 15 TSSs in green could be assigned to more than one category. Twenty-two TSSs were found in libraries of both green and white plastids.
[See online article for color version of this figure.]

