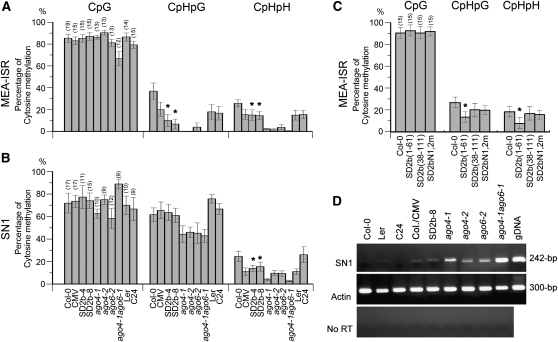
Figure 7.
Analysis of Endogenous DNA Methylation in SD2b and SD2b Mutant Transgenic and SD-CMV–Infected Plants.
(A) to (C) Percentage of CG, CNG, and CNN methylation by bisulphite sequencing analysis of endogenous MEA-ISR and SN1 loci in the indicated genotypes. The number of clones analyzed is in parenthesis, and the original data are shown in Supplemental Figure 7 online. The statistical analysis was performed using the OriginPro 8 program. The bars denote the se of the means, and the corresponding values of SD2b-4, SD2b-8, and SD2b(1-61) (labeled with asterisks) are significantly different from those of Col-0 (one-way analysis of variance, P < 0.05).
(D) Quantitative RT-PCR showed increased SN1 transcript expression in line 2b-8 and SD-CMV–infected plants and ago mutant plants compared with their control background plants.

