Figure 9.
Direction of the Signal Translocation.
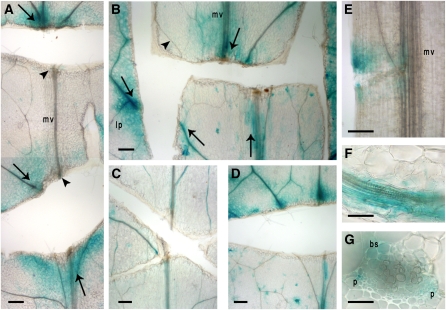
Various incisions in rosette leaves and petioles of ProGA2ox2:GUS-expressing Arabidopsis plants (top part of images are closest to the leaf tip). Bars = 210 μm in (A) to (E) and 55 μm in (F) and (G). Arrows mark GUS activity and flow orientation, arrowheads mark lack of GUS activity in cut veins. bs, bundle sheath; lp, leaf periphery; mv, midvein; p, phloem.
(A) Two parallel horizontal cuts (perpendicular to the midvein axis) in the blade caused GUS accumulation (arrows, marking signal flow orientation) that is nonpolar in the leaf periphery with high activity above the upper cut of the midvein. Lack of GUS activity is indicated between the cuts (arrowheads).
(B) An “H” shape cut displaying the same peripheral nonpolar nature, as in (A), and emphasizing a preferable transport along the midvein.
(C) Paclobutrazol substantially decreases GUS expression.
(D) GA restores expression in paclobutrazol-treated leaves.
(E) GUS expression above the cut, indicating basipetal polar flow along the petiole.
(F) and (G) High magnification of leaf vascular bundles showing longitudinal and cross-section views, respectively. GUS expression localizes in the bundle sheath and phloem cells. See Figure 10 for a summary illustration.

