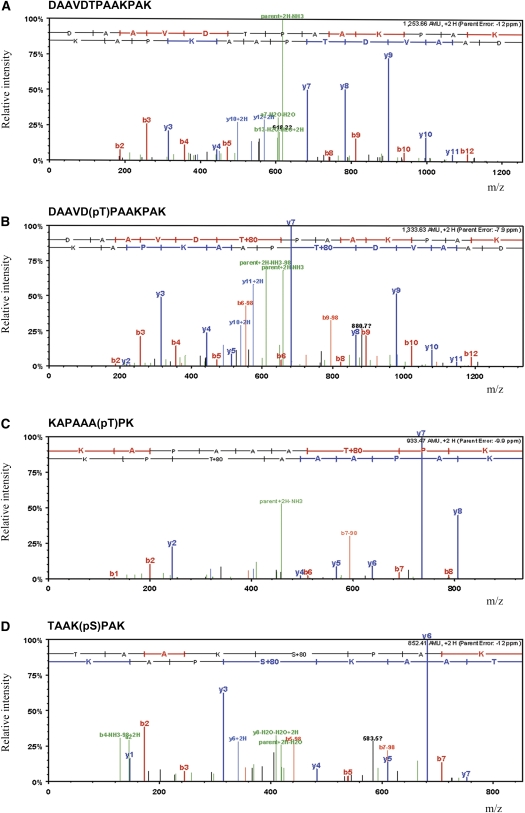
Figure 5.
Examples of Mass Spectra from Fragmented Phosphorylated and Nonphosphorylated Peptides.
The major ion peaks are annotated as the parent ion and a series of y and b ions depending on whether fragmentation has occurred from the N or C terminus of the peptide, respectively. Fragment ion scan spectrum annotated by Scaffold 3 (Proteome Software).
(A) Peptide DAAVDTPAAKPAK from histone H1 WH1A2 with Mascot score of 67.7.
(B) Phosphorylated form of peptide DAAVD(pT)PAAKPAK with Mascot score of 65.2. Evidence of a phosphopeptide is supported by the loss of 98 D (corresponding to the loss of neutral phosphate) from the parent ion and from fragment ions b6 and b9.
(C) Phosphorylated form of peptide KAPAAA(pT)PK with Mascot score of 43.4.
(D) Phosphorylated form of peptide TAAK(pS)PAK with Mascot score of 51.1.

