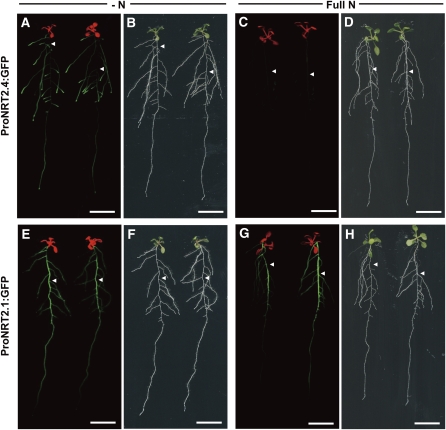
Figure 2.
GFP Fluorescence in ProNRT2.4:GFP and ProNRT2.1:GFP Transgenic Plants.
GFP fluorescence ([A], [C], [E], and [G]) and bright-field ([B], [D], [F], and [H]) images of ProNRT2.4:GFP ([A] to [D]) and ProNRT2.1:GFP ([E] to [H]) transgenic plants. Seven-day-old seedlings grown on full N plates were further incubated for 3 d either without a N source (−N; [A], [B], [E], and [F]) or on 10 mM NO3– (Full N; [C], [D], [G], and [H]) before detection. GFP fluorescence (green) was merged with chlorophyll autofluorescence (red) in (A), (C), (E), and (G). Arrowheads indicate the position of the main root. Bars = 1 cm.

