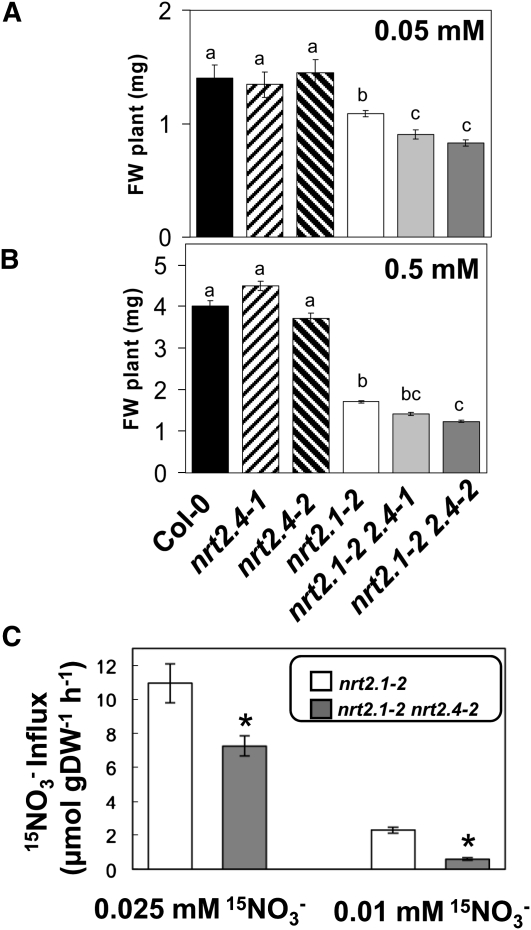
Figure 7.
The nrt2.1 nrt2.2 nrt2.4 Triple Mutants Show Decreased Growth in Low NO3– Conditions.
(A) to (B) Fresh weight (FW) of Col-0, nrt2.4-1, nrt2.4-2, nrt2.1-2 nrt2.4-1, and nrt2.1-2 nrt2.4-2 mutant seedlings. Seedlings were grown for 12 d on MGRL-based vertical plates containing the indicated amount of N. Error bars represent sd of five biological replicates. Letters indicate statistically significant classes (P < 0.01).
(C) 15NO3– influx measurement in nrt2.1-2 and nrt2.1-2 nrt2.4 mutant seedlings. Seedlings were grown on MGRL-based plates 8 d on 10 mM NO3–then 5 d without N. 15NO3– influx was measured after 5 min of labeling in complete nutrient solution containing either 0.025 or 0.01 mM 15NO3–. Error bars represent se of eight biological replicates. Asterisks indicate statistically significant differences between nrt2.1-2 and nrt2.1-2 nrt2.4 (P < 0.01). DW, dry weight.

