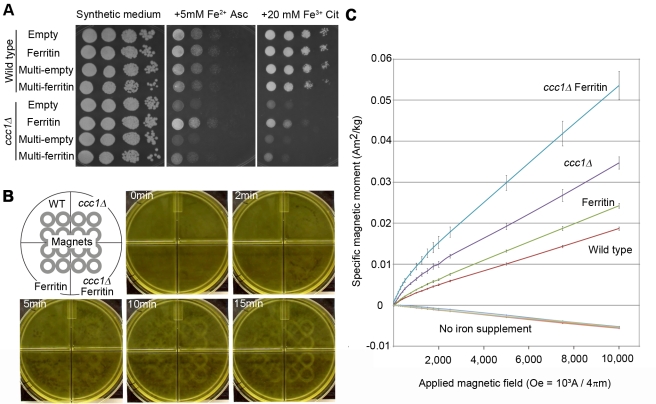
Figure 1. Magnetization of yeast.
(A) Iron tolerance affected by ccc1Δ, ferritin, and Fe2+/Fe3+. Culture of 2.0 OD600 was diluted 102, 103, 104, and 105-fold in water, spotted by 10 ul from left to right for each strain, and grown on indicated plates. Empty, single-copy empty plasmid-harboring strain; Ferritin, single-copy ferritin gene set plasmid-harboring strain; Multi-empty, multi-copy empty plasmid-harboring strain; Multi-ferritin, multi-copy ferritin gene set plasmid-harboring strain. (B) Cell attraction towards magnet. Cell suspensions were placed over magnets (4×4 gray circles) and a picture taken at indicated times. Corresponding video is Video S1. (C) SQUID magnetization curve. Induced specific magnetic moment was measured as a function of applied magnetic field. Lines for the four strains without ferric citrate supplementation (No iron supplement) are almost identical and overlapped; mean ± s.d. (n = 3).

