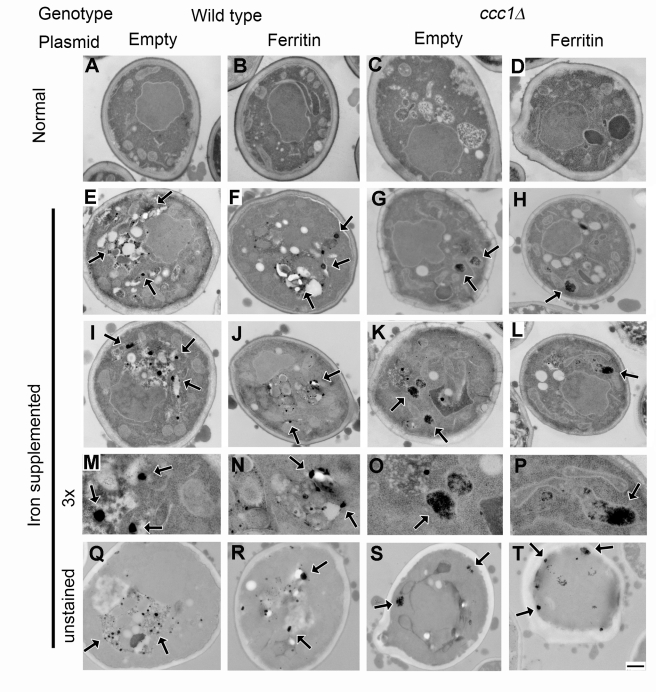
Figure 2. Electron micrographs of magnetized cell.
Normally grown cells (A–D) and iron-supplemented cells (E–T) of wild-type (A, E, I, M, and Q), ferritin-expressor (B, F, J, N, and R), ccc1Δ (C, G, K, O, and S), and ccc1Δ ferritin-expressor (D, H, L, P, and T) are shown. (M–P) 3× magnification of (I–L), respectively. Unstained sections are shown in (Q–T). Arrows indicate electron-dense particles. Scale bar, 500 nm.

