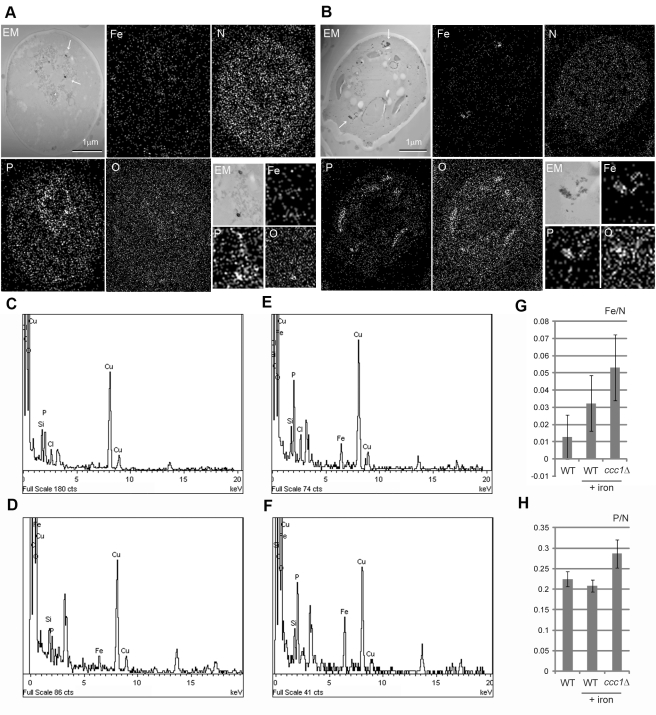
Figure 3. EDS elemental analysis for magnetized cell.
Wild type (A) and ccc1Δ (B) are analyzed for counter image of dark-field electron micrograph (EM), iron (Fe), nitrogen (N), phosphorous (P), and oxygen (O). Arrows indicate electron-dense deposits. Two-fold magnifications are shown on the bottom-right. EDS spectra are shown for cytoplasmic region of wild type (C) and ccc1Δ (D) and electro-dense particles of wild type (E) and ccc1Δ (F), respectively. Vertical axis is for counts and horizontal axis is for energy (keV). Note copper peaks are from EM grid. Unassigned peaks are presumably from uranium used for staining. Relative element counts of iron (G) and phosphorous (H) versus nitrogen are calculated for sectioned whole cell region of normally grown wild type, iron-supplemented (+iron) wild type, and ccc1Δ.

