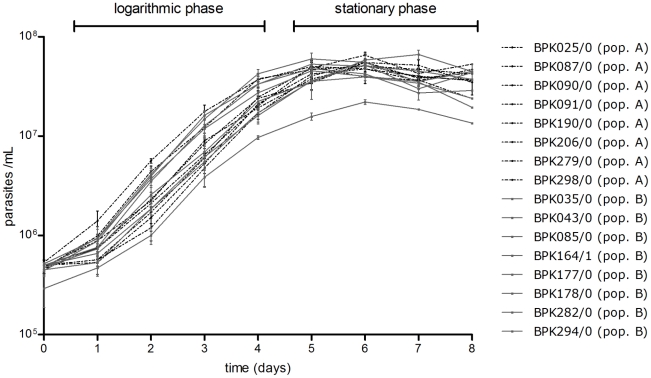
Figure 3. In vitro promastigote growth profiles of studied L. (L.) donovani isolates.
The growth profiles of population A isolates (in black dotted curves) and population B isolates (in full black curves) largely coincide and clearly indicate that all studied isolates had a similar in vitro promastigote growth dynamic. The growth curve shown for each isolate represents the average growth assessed in 3 repeated experiments.

