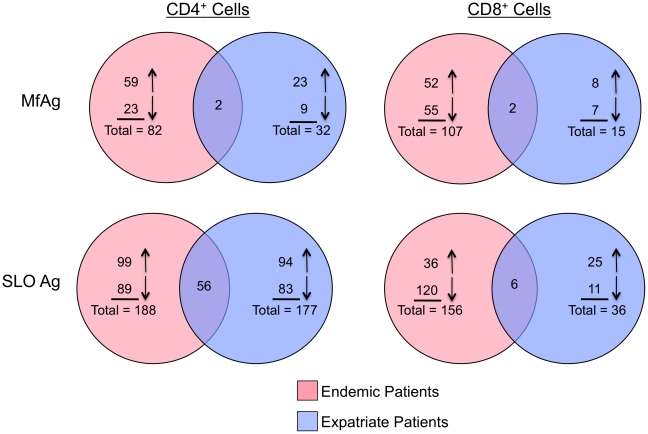
Figure 5. Venn diagrams illustrating the number of Ag-driven genes.
Venn diagrams representing the number of genes either upregulated (upward facing arrows) or downregulated (downward facing arrows) to parasite (microfilarial Ag; MfAg, top panels) and nonparasite (streptolysin O; SLO, bottom panels) antigens in endemic (pink circles) and expatriate (blue circles) filarial-infected patients. CD4+ T cells are shown in the left panels and CD8+ T cells are in the right panels. Numbers represent genes that were significantly up-or down-regulated (p<0.001) in comparison to unstimulated cells.

