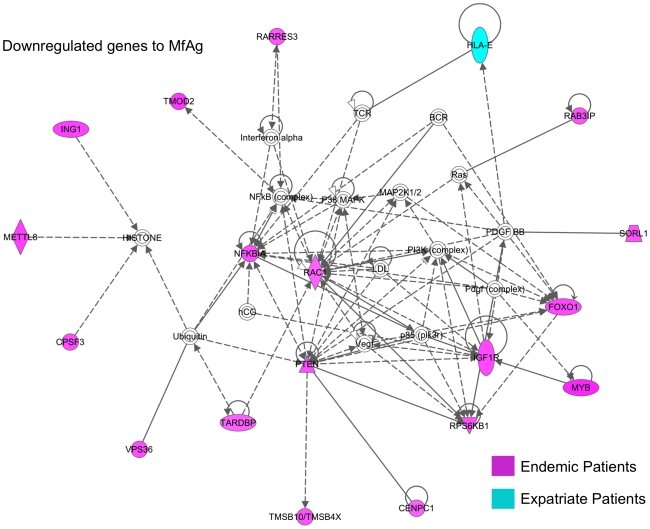
Figure 7. Network of microfilarial Ag-driven downregulated genes.
Major network (www.ingenuity.com) of differentially expressed molecules that were significantly downregulated (p<0.001) to MfAg in either CD4+ or CD8+ T cells of endemic (in red) and expatriate (in blue) patients. Lines represent direct (solid lines) and indirect (dashed lines) relationships between molecules and molecules within double circles represent complexes of genes.

