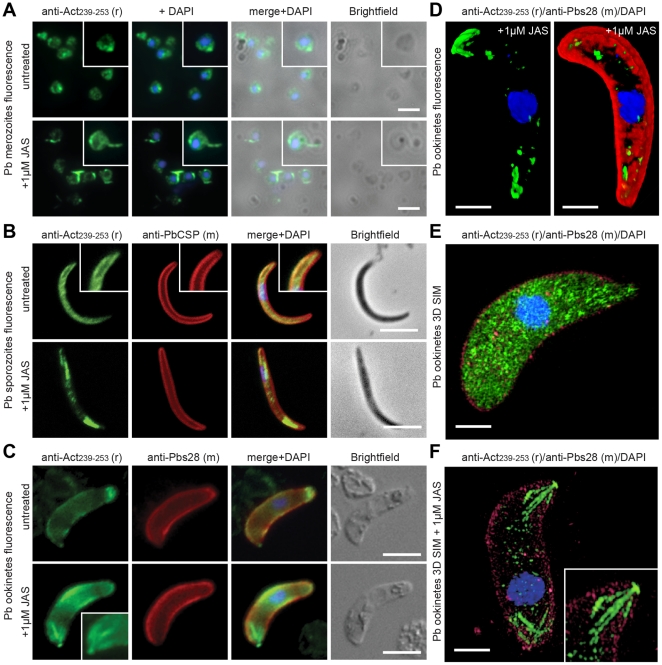
Figure 2. Spatial distribution of actin in free malaria parasite zoites.
A) Widefield IFA of P. berghei merozoites with and without 1 µM JAS, labelled with rabbit anti-Act239–253 (Green) and the nuclear marker DAPI. Scale bar = 2 µm. B) Widefield IFA of P. berghei sporozoites with and without 1 µM JAS, labelled with rabbit anti-Act239–253 (Green), surface marker PbCSP (Red) and DAPI (Blue). Scale bar = 5 µm. See also Movie S1 C) Widefield IFA of P. berghei ookinetes with and without 1 µM JAS, labelled with rabbit anti-Act239–253 (Green), surface marker Pbs28 (Red) and DAPI (Blue). Scale bar = 5 µm. D) 3D reconstruction of widefield IFA with deconvolution of 1 µM JAS treated P. berghei ookinete, labelled with rabbit anti-Act239–253 (Green), Pbs28 (Red), and DAPI (Blue). Scale bar = 5 µm. See also Movie S2. E–F) 3D structured illumination microscopy (3D SIM) of P. berghei ookinetes labelled with rabbit anti-Act239–253 (Green), surface marker Pbs28 (Red) and DAPI (Blue) in the absence (E) and presence of 1 µM JAS (F). Scale bar = 2 µm. See also Movie S3, S4. Gamma settings were altered in 3D reconstructions.

