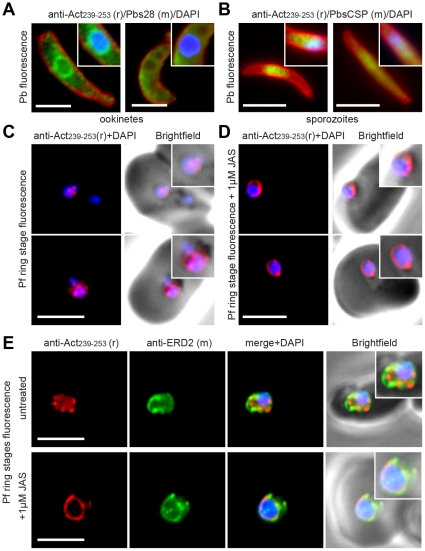
Figure 4. Concentration of actin labelling in the nucleus and around the nuclear periphery.
Widefield IFA of representative P. berghei A) ookinetes and B) sporozoites that show pronounced nuclear labelling using rabbit anti-Act239–253 (Green) surface markers Pbs28 or PbCSP (Red) and DAPI (Blue). Scale bar = 5 µm. See also Movie S5. C) Widefield IFA of P. falciparum rings labelled with rabbit anti-Act239–253 (Red) and DAPI (Blue). D) As C but following 6 hour JAS treatment. E) Two colour widefield IFA using rabbit anti-Act239–253 (Red), rat anti-ERD2 (Green) and DAPI (Blue) in absence or presence of 1 µM JAS. All scale bars = 5 µm.

