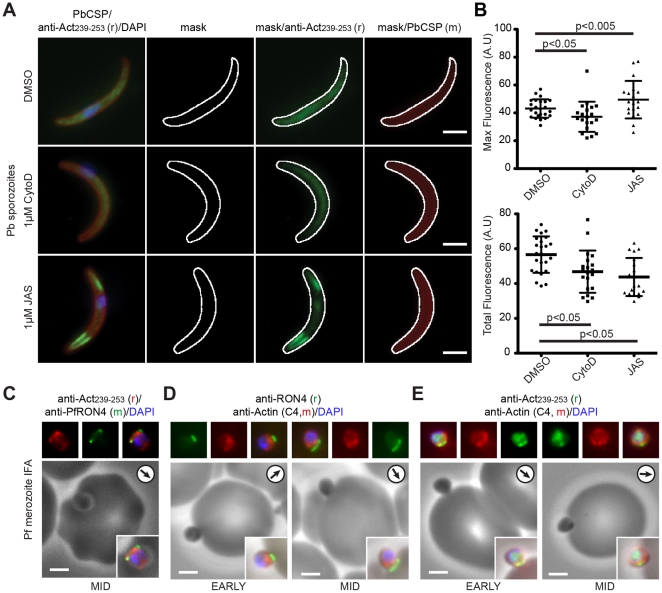
Figure 6. Anti-Act239–253 shows preferential labelling of actin filaments.
A) Widefield IFA with deconvolution of sporozoites treated with DMSO control, 1 µM cytochalasin D or 1 µM JAS labelled with rabbit anti-Act239–253 (Green), PbCSP (Red) and DAPI (Blue). Scale bar = 2 µm. Mask determined by anti-PbCSP labelling (see Materials and Methods). B) Maximum and total fluorescence levels of sporozoites treated with 1 µM JAS, 1 µM cytochalasin D and DMSO control. Significance as shown, unpaired t-test. C) Widefield IFA with deconvolution of invading P. falciparum merozoite labelled with rabbit anti-Act239–253 (Red) mouse anti-PfRON4 (Green) and DAPI (Blue). Scale bar = 2 µm. Arrows show direction of invasion. D–E) Widefield IFA with deconvolution of invading P. falciparum merozoites labelled with mouse anti-Actin (C4, Red) co-labelled with rabbit anti-PfRON4 (Green) (D) or rabbit anti-Act239–253 (Green) (E). DAPI (Blue) and Scale bar = 2 µm.

