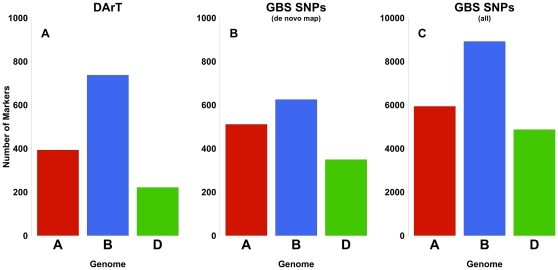
Figure 3. Histogram of number of markers in the three wheat genomes for DArT and GBS SNP genetic maps.
A) The number of markers assigned to each genome from the DArT genetic map [25] and B) the number of markers in each genome from the de novo genetic map constructed using GBS SNP markers and the AntMap Algorithm. C) The total number of SNPs assigned to each genome using the bin mapping approach in SynOpDH (note different units on vertical axis).

