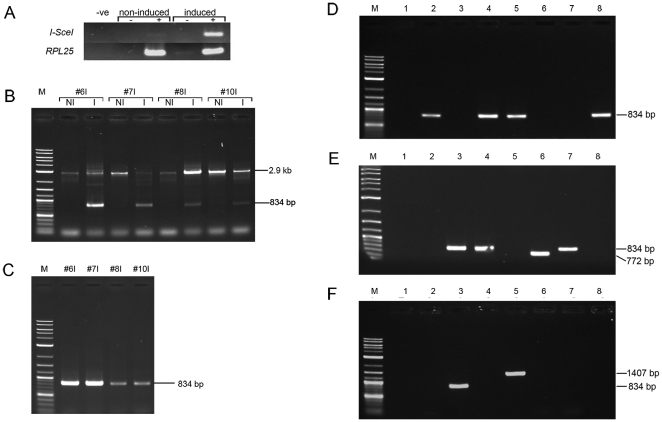
Figure 2. PCR analysis of DSB induction and repair.
(A) RT-PCR (+) demonstrates increased I-SceI mRNA accumulation after induction with 0.7 M ethanol in tobacco leaf tissue. Low levels of I-SceI mRNA accumulate in non-induced leaf tissue. No reverse transcriptase (−) and no template (-ve) controls are shown. Template control RT-PCRs used RPL25 mRNA primers. (B) The DSB region was PCR amplified from 4 tobacco D4A2 plants using primers DSBF1 and DSBR1 which flank the two I-SceI sites. Only the full length 2.9 kb band is amplified from template DNA extracted prior to DSB induction (NI). An additional ∼834 bp band is amplified from template DNA extracted after DSB induction (I). 834 bp is the expected size of the DSB region after excision of the spacer region. (C) After HincII digestion of induced template DNA only the 834 bp band is amplified. No amplification is observed from those molecules which have not undergone dao1 excision. Individual repair junctions were amplified by smPCR (D–F). The majority of products amplified were ∼834 bp in size. Some repair events resulted in deletions leading to products <834 bp (E) while others resulted in insertion leading to products >834 bp (F). Examples shown are amplified from D4A2#6I template DNA.

