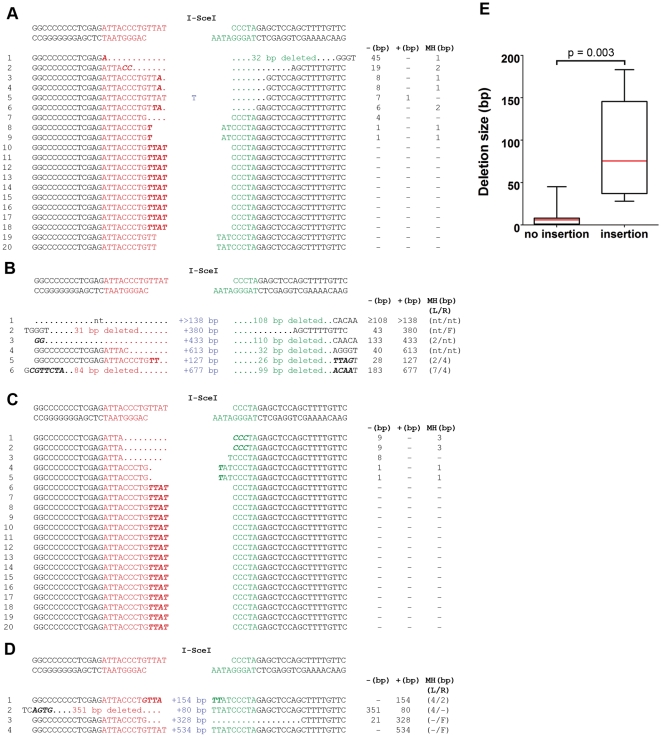
Figure 3. Sequence of double strand break repair events.
The sequence surrounding the junction sites is shown for 20 randomly chosen repair products (tobacco, A; Arabidopsis, C), and the repair products that harboured insertions (tobacco, B; Arabidopsis, D). The original sequence generated by I-SceI cleavage is shown at the top of A–D (the sequence of both strands is shown). Bases from the I-SceI site upstream of dao1 are shown in red, bases from the I-SceI site downstream of dao1 are shown in green. Inserted bases are shown in blue. In some instances microhomology was observed between the terminal bases of the fragments being joined (bold italics). Columns to the right of A–D indicate the total length of deletion (−), insertion (+) and microhomology (MH, not including I-SceI site overlap), nt signifies not testable, F indicates the insertion of filler DNA. Numbers in brackets indicate length of deletion or microhomology observed at the junction either upstream (L) or downstream (R) of the insertion. In tobacco the median deletion size was considerably larger in DSB repair events involving insertion than in repair events not involving insertion (E). The box-and-whisker plot shows the median (red line), the first and third quartiles, and the upper and lower limits of the length of deletions (two-tailed Mann-Whitney U test).

