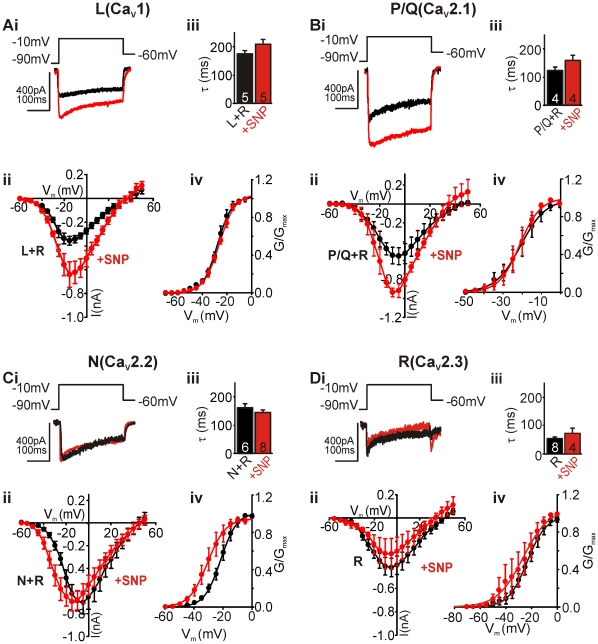
Figure 2. NO differentially modulates expressed CaVs, potentiating L (CaV1) and P/Q-type (CaV2.1).
A-Di, Raw traces of pharmacologically isolated currents (+R-type) in A-Ci (black trace), and the same current from cells treated with SNP (red). Traces generated by depolarising steps from −90 mV to −10 mV (holding potential of −60 mV). Aii–Dii, Average IVs of control (black circles) and SNP-treated (red circles) neurons. Aiii–Diii, Summary bar graph showing mean inactivation kinetics (τ) of currents in control (black) and SNP-treated (red) conditions. Aiv–Div, Mean activation curves of currents recorded from untreated (black) and SNP-treated (red) cells. Curves are fitted to conductances applying a Boltzmann equation.

