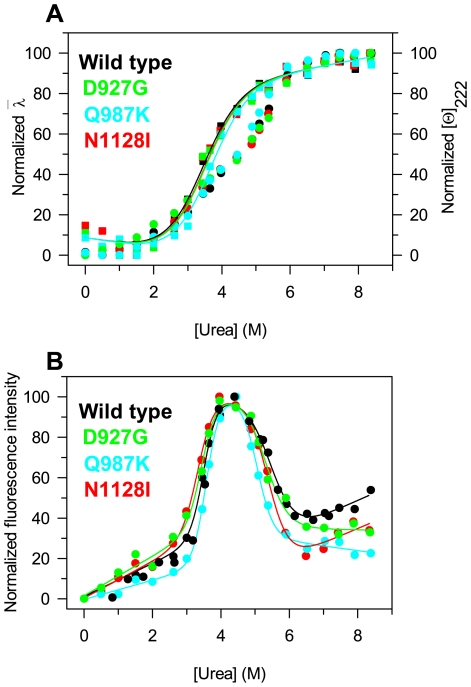
Figure 6. Urea-induced equilibrium unfolding of PTPρ wild-type and mutants.
(A) Normalized intensity-averaged emission wavelength ( , left axis, filled circles) and molar ellipticity at 222 nm reported after removal of the high-frequency noise and the low-frequency random error by SVD ([Θ]222, right axis, empty squares); the continuous lines represent the nonlinear global fitting of the molar ellipticities at 222 nm data to Eqn. 4 for PTPρ calculated as described in Materials and Methods. (B) Normalized relative fluorescence intensities at 338 nm; the continuous lines represent the nonlinear regression fit of the relative fluorescence intensities at 338 nm to Eqn. 6 calculated as described in Materials and Methods. The reversibility points (empty circles) are shown, for clarity, only for the relative fluorescence intensities of the wild-type and were not included in the nonlinear regression analysis. All spectra were recorded at 10°C as described in Materials and Methods.

