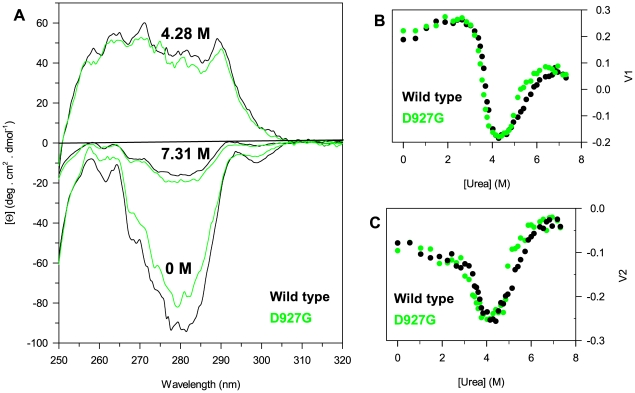
Figure 7. Effect of urea on near-UV CD spectra of PTPρ wild-type and D927G.
(A) Near-UV CD spectra of wild-type and D927G in 0 M, 4.28 M and 7.31 M urea were recorded in a 1-cm quartz cuvette at 2.4 mg/ml protein concentration at 10°C in 20 mM Tris/HCl, pH 7.5 containing 0.2 M NaCl and 2 mM DTT. (B) and (C) Near-UV CD changes of wild-type and D927G at increasing urea concentrations reported as the first (V1, B) and the second (V2, C) column of the V matrix. V1 and V2 were obtained by SVD of the near-UV CD spectral data as described in the text.

