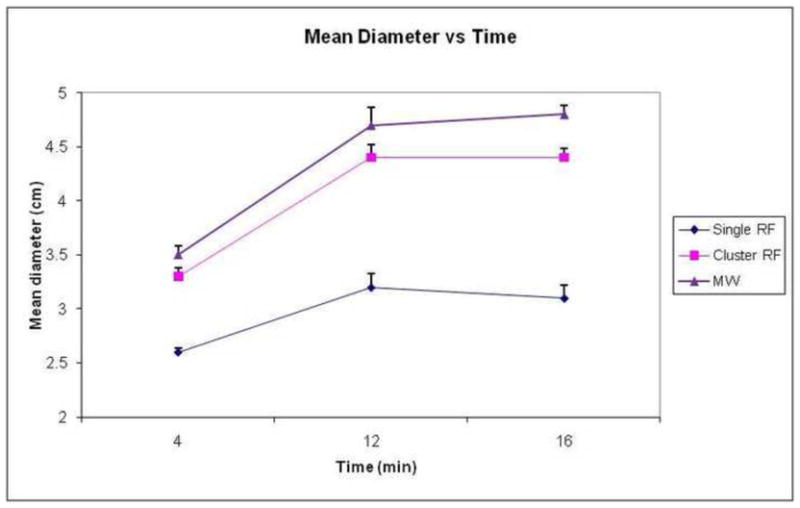
Figure 1.

Graph demonstrates change in mean ablation diameter over time by ablation device in ex vivo bovine liver. Note that MW ablations (triangle markers) are larger than single RF (diamond markers) at each time point. There was no statistical difference between MW and cluster RF (square markers). Error bars represent standard error of the mean.
