
Figure 5.
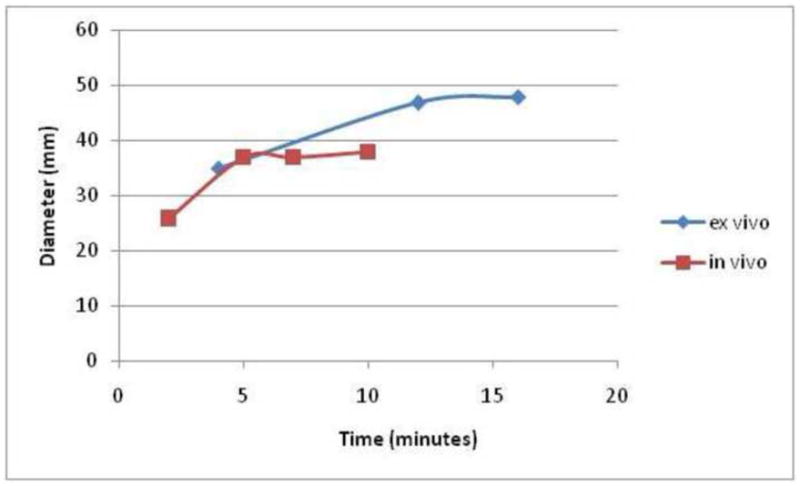
Graph comparing the ex vivo (bovine) and in vivo (porcine) mean MW ablation zone diameter over time. At early time points, the ablation zone sizes are similar between the models, with the in vivo ablation zones smaller at later time points, possibly related in part to tissue contraction and on greater reliance on thermal conduction later in the ablation.