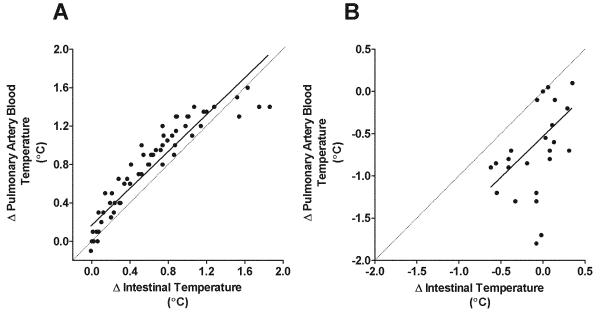
Figure 4. Core temperatures with whole body cooling.
Following heat stress, subsequent whole body cooling caused a larger reduction in pulmonary artery temperature than intestinal temperature (P = 0.04; Panel A), which resulted in differences in temperatures the end of the cooling stimulus (P = 0.003; Panel B). These data demonstrate that intestinal temperature lags pulmonary artery temperature during rapid cooling of heat stressed individuals. Open triangles indicate individual data points while columns depict mean responses. Please note that N=6 for these analyses but some data points are obscured because they overlap other data points. * denotes a significant difference between temperature measures (P < 0.05).

