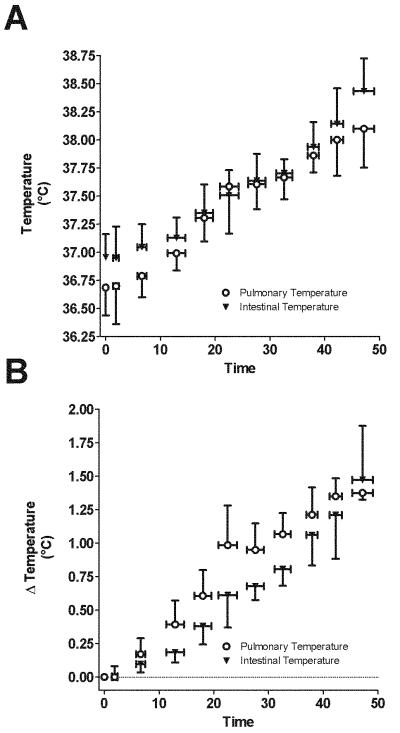
Figure 5. Changes in core temperature during heat stress and whole body cooling.
Throughout the heat stress there was a relatively strong relationship between pulmonary artery and intestinal temperatures (r = 0.93), however, this relationship weakens during subsequent whole body cooling (r = 0.58). Solid line depicts the regression between the indicated values. Dashed line represents the line of identity. Values are from 8 subjects for heat stress and 6 subjects for whole body cooling.

