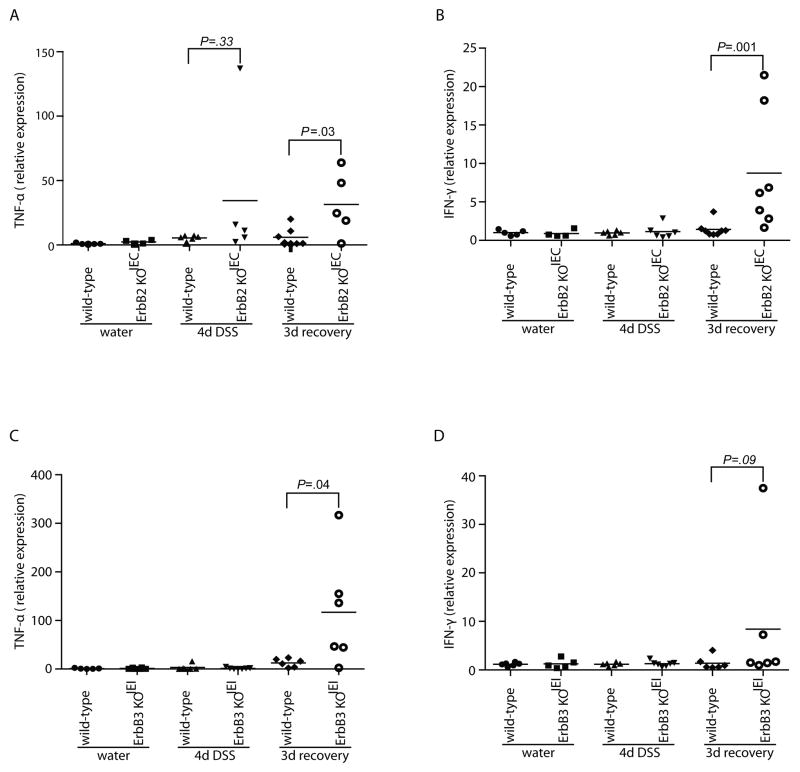
Figure 4. Colonic TNF-α expression is increased in ErbB2 KOIEC and ErbB3 KOIEI mice during recovery from DSS-induced colitis.
TNF-α (A, C) and IFN-γ (B, D) mRNA transcript levels were measured by real-time RT-PCR from whole colon RNA of the indicated genotypes and treatment groups. Bars indicate mean expression of transcripts normalized for actin; n=4–7.

