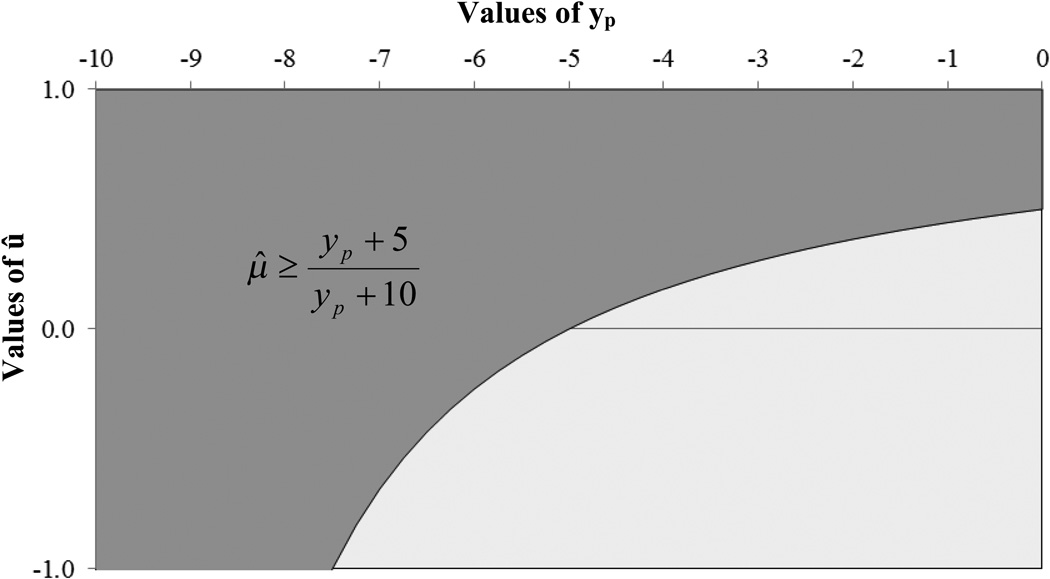
Figure 1. Distribution of values of μ̂ and yp that violate monotonicity.
μ̂ = eRUM estimator for a given health state
yp = years lived in perfect heath from a single survey response for the given health state (multiplied by −1 for states deemed worse than dead).
Dark grey area = joint distribution of yp and μ̂ associated with monotonicity violations.

