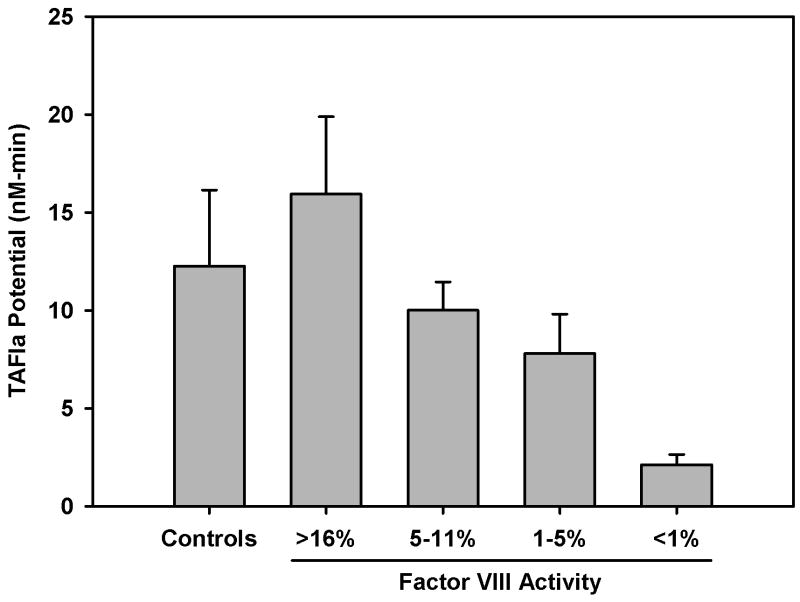
Figure 2.
Average TAFIa potential in haemophilia A and control subjects. Subjects were grouped by their fVIII level at the time of blood collection (Table 1). Since, in most cases, the TAFIa potential of the group with < 1% fVIII was only a reflection of one point above baseline this group was not included in the statistical test but is shown for relative comparison. No statistically significant difference in the TAFIa potential was found among the controls, >16%, 5-11% or 1-5% fVIII groups. Between group comparisons were conducted using one way ANOVA and the data are presented as mean ± standard error of the mean.

