
Figure 2.
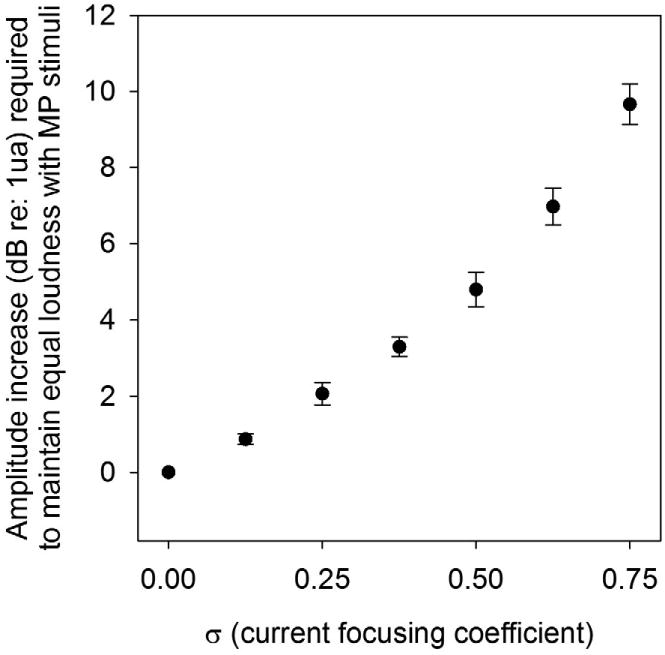
Plot of incremental amount of current (in dB re: 1μa) required for PTP stimuli (of differing σ values) to maintain equal loudness of as a MP (σ = 0.00) stimulus at the “Most Comfortable Level.” Data is averaged across all subjects. Error bars are ± 1 standard error of the mean.