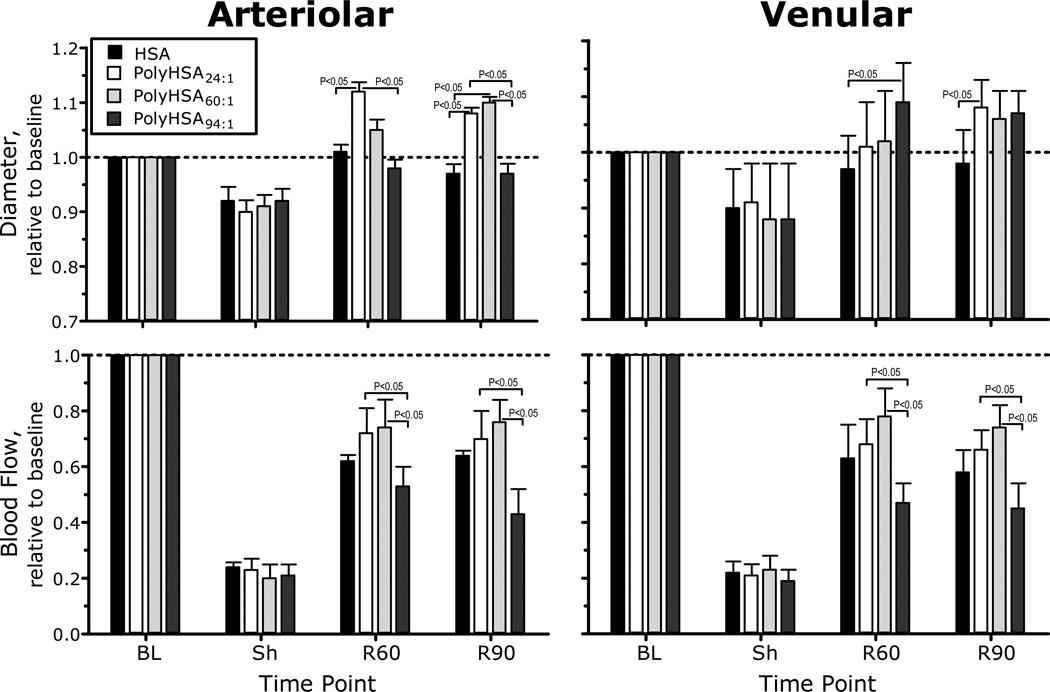
Figure 3.
Relative changes with respect to baseline in arteriolar and venular hemodynamics for PolyHSA24:1, PolyHSA60:1 and PolyHSA94:1. The broken line represents the baseline level. Diameters (µm, mean ± SD) for each animal group at baseline were as follows: PolyHSA24:1 (arterioles (A): 54.6 ± 9.7, n = 38; venules (V): 55.8 ± 8.2, n = 46); PolyHSA60:1 (A: 56.7 ± 9.1, n = 40; V: 57.6 ± 9.2, n = 47) and PolyHSA94:1 (A: 55.7 ± 7.2, n = 36, V: 54.8 ± 8.5, n = 38). n = number of vessels studied. RBC velocities (mm/s, mean ± SD) for each animal group at baseline were as follows: PolyHSA24:1 (A: 4.3 ± 1.2, V: 2.1 ± 0.6); PolyHSA60:1 (A: 4.0 ± 1.1; V: 2.2 ± 0.9) and PolyHSA94:1 (A: 4.2 ± 0.9; V: 2.3 ± 0.8). Calculated flows (nl/s, mean ± SD) for each animal group at baseline were as follows: PolyHSA24:1 (A: 10.8 ± 3.2; V: 6.5 ± 2.1); PolyHSA60:1 (A: 10.4 ± 3.2; V: 6.0 ± 1.9) and PolyHSA94:1 (A: 10.7 ± 2.4; V: 6.3 ± 2.3). Parameters were analyzed before hemorrhage (Baseline, BL), after hemorrhage (Shock, Sh, 60 min after hemorrhage induction), and at 60 and 90 min after fluid resuscitation (Resuscitation 60 min, R60 and Resuscitation 90 min, R90).

