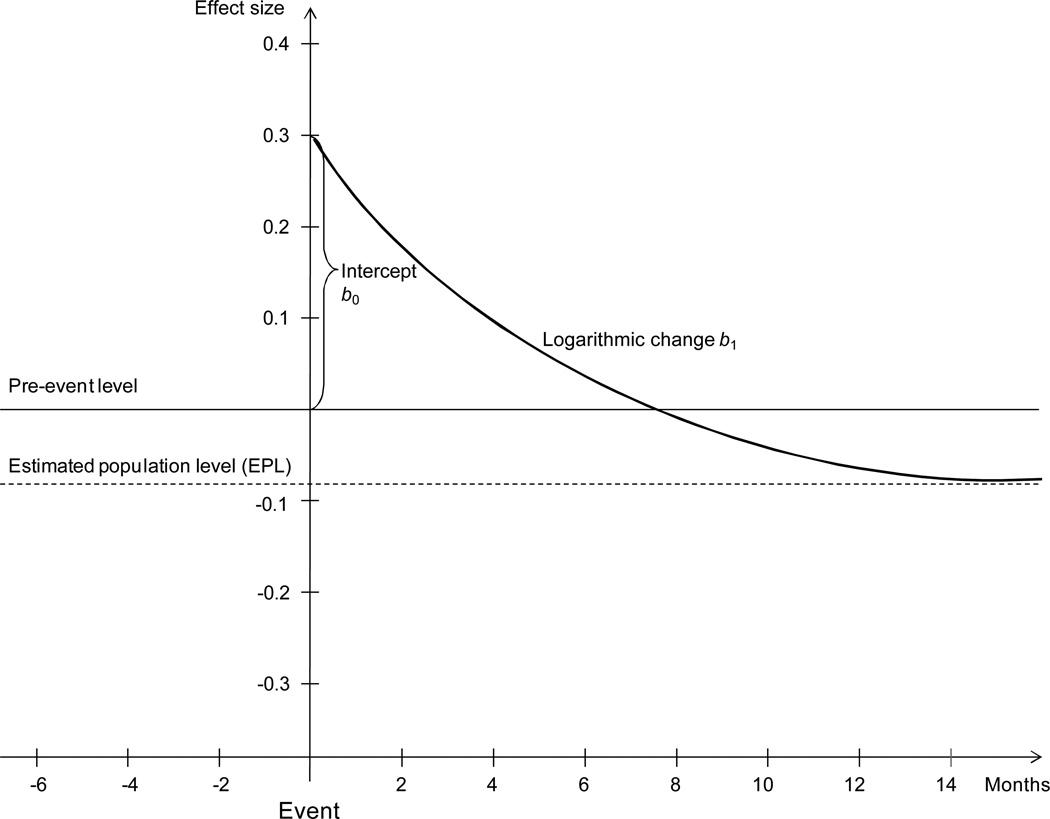
Figure 2.
Example for a prospective adaptation pattern. The solid horizontal line represents the average pre-event level of SWB. The dashed horizontal line represents the estimated population level. The immediate hedonic reaction to the event is reflected in the intercept b0 of the change curve. The rate of change over time is reflected in the logarithmic change parameter b1. The time lag between the first measurement occasion and the event is not depicted but fixed to a value of zero.

