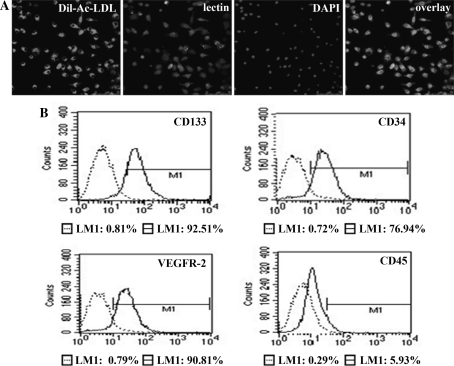
Fig. 1.
The isolation and characterisation of EPCs. a EPCs stained positive for Dil-Ac-LDL, lectin, and DAPI (magnification ×400). b FACS analysis of primary EPCs cultured for 5–7 days in low-glucose DMEM supplemented with 10% FCS. Cells labelled with fluorescent antibodies CD133, CD34, CD45, and VEGFR-2 are shown in the areas to the right in each box. The left area in each box represents the corresponding negative control labelling, and the line denotes a positive gate. The numbers are the percentage of positive cells

