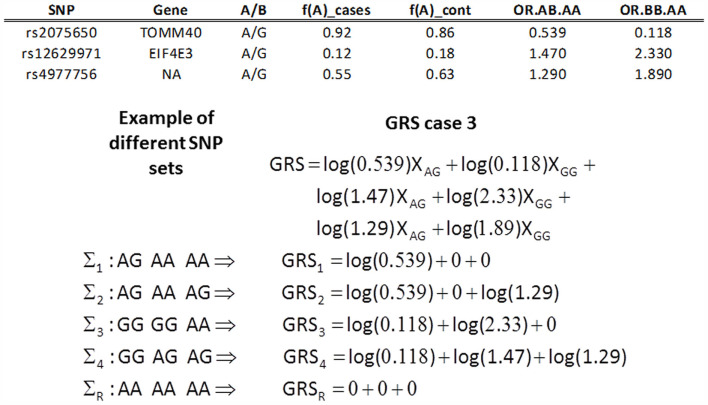
Figure 2.
Example of GRS (case 3 in Table 1). The table on top reports the A/B alleles for the three SNPs, the frequencies of A allele in cases and controls, and the odds ratio for exceptional longevity in carriers of the AB allele relative to carriers of the AA allele (OR.AB.AA), and the odds ratio for exceptional longevity in carriers of the BB allele relative to carriers of the AA allele (OR.BB.AA). The bottom panel shows the calculations of the GRS with weights as in case 3. The profile ΣR denotes the referent group.

