
Figure 1.
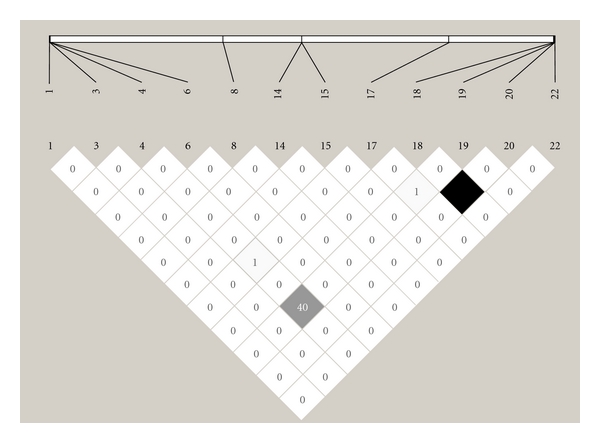
The LD plot for all NR1C3 variants that were found in the non-IBD control group. r 2 = 0 (white), 0 < r 2 < 100 (shadows of grey), and r 2 = 100 (black). Numbers within squares: r 2 values (0–100%), LD: linkage disequilibrium.
Official websites use .gov
A
.gov website belongs to an official
government organization in the United States.
Secure .gov websites use HTTPS
A lock (
) or https:// means you've safely
connected to the .gov website. Share sensitive
information only on official, secure websites.
The LD plot for all NR1C3 variants that were found in the non-IBD control group. r 2 = 0 (white), 0 < r 2 < 100 (shadows of grey), and r 2 = 100 (black). Numbers within squares: r 2 values (0–100%), LD: linkage disequilibrium.